We move onto our next strand for the term: Probability and Statistics
This week we will focus on the following:
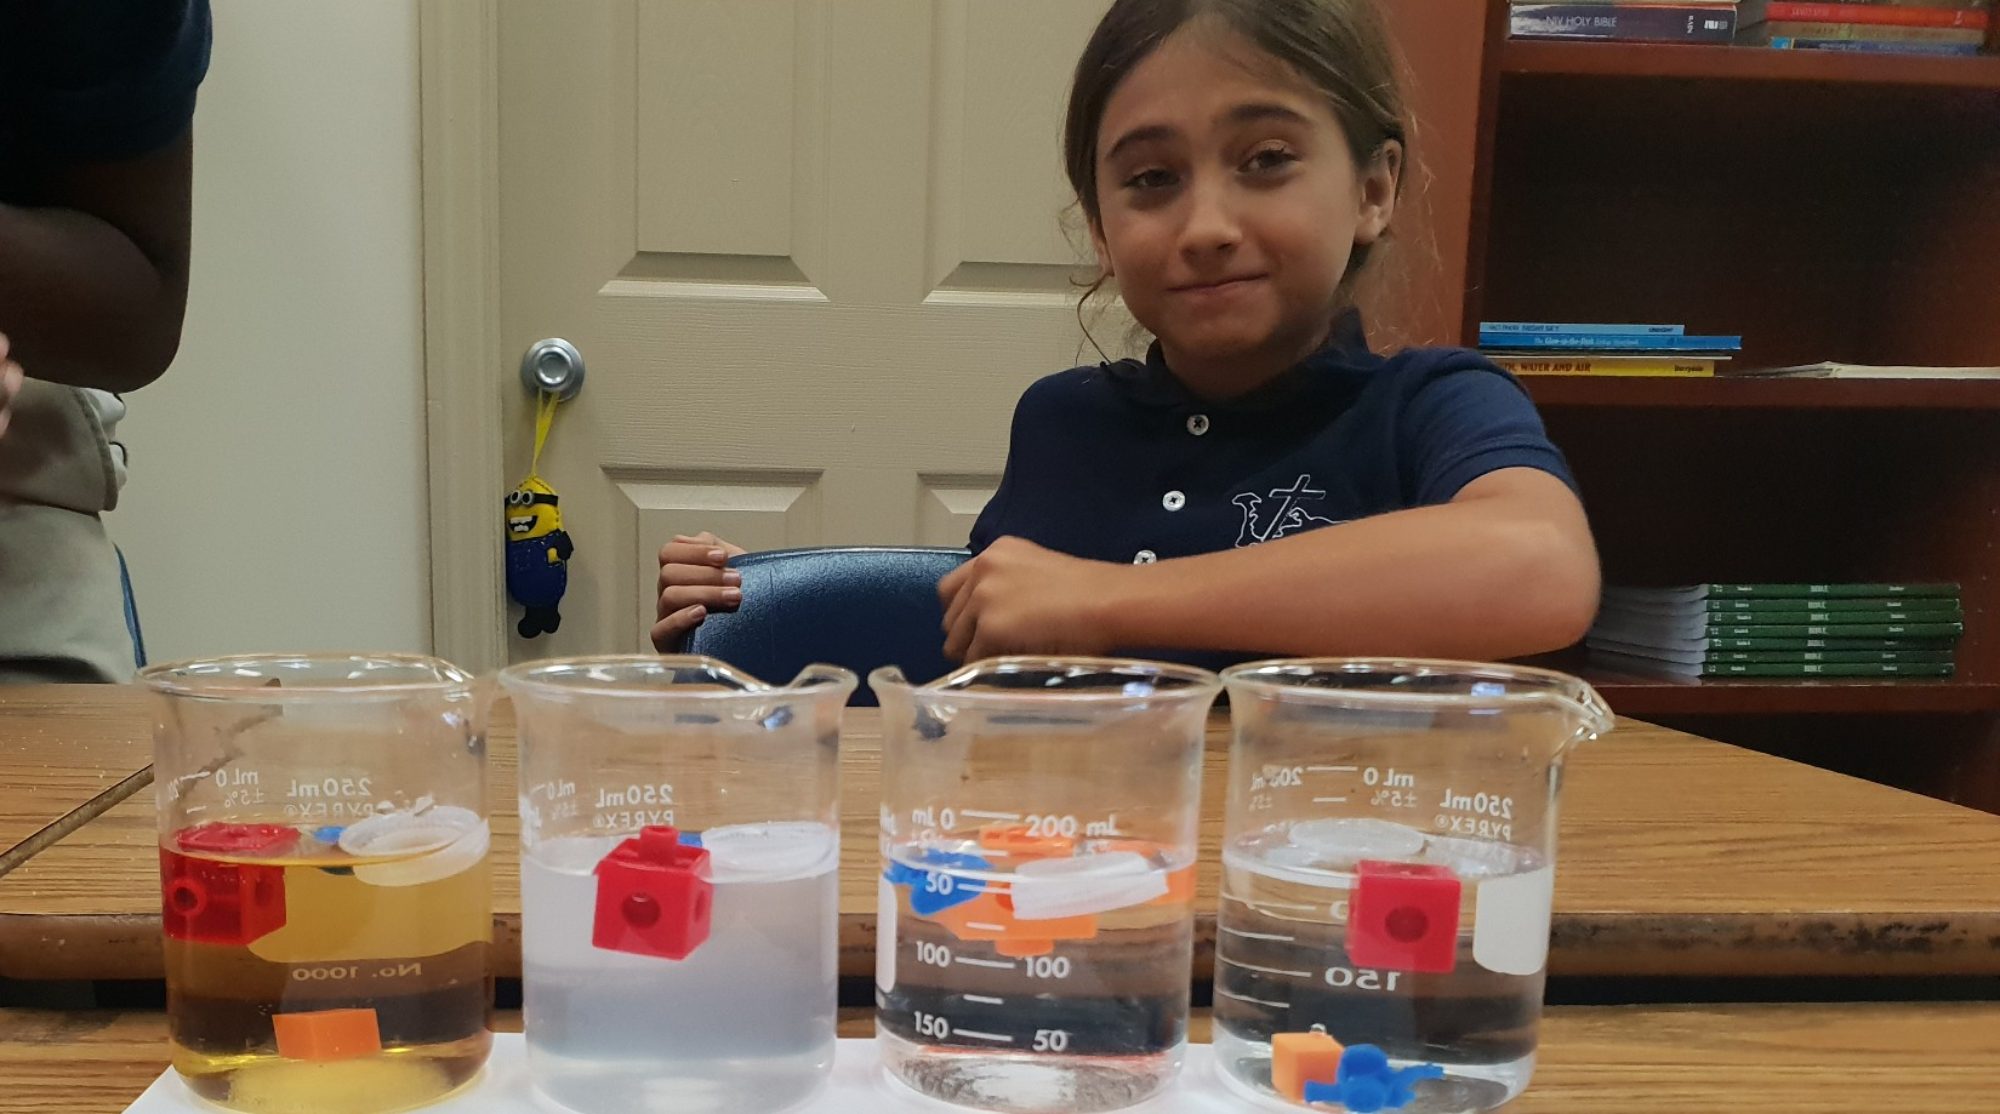
What is data?
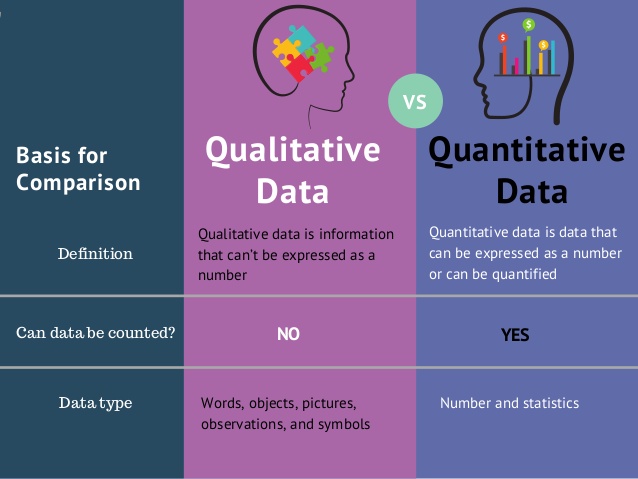
Qualitative or quantitative data
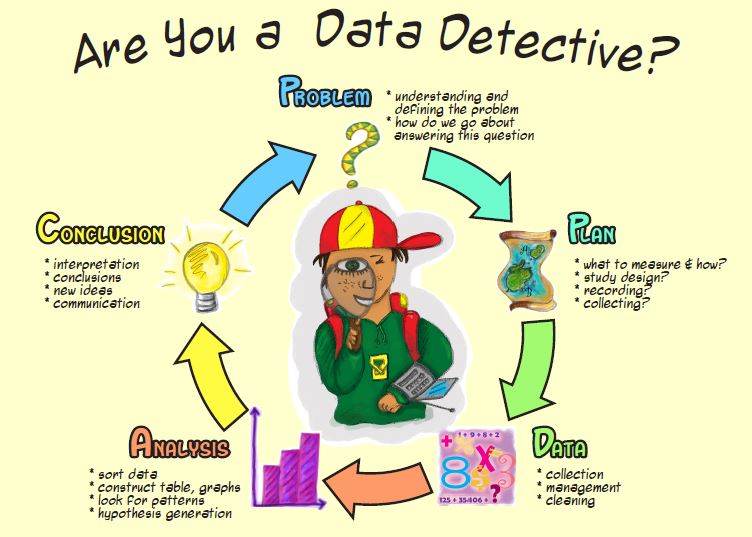
Data handling cycle
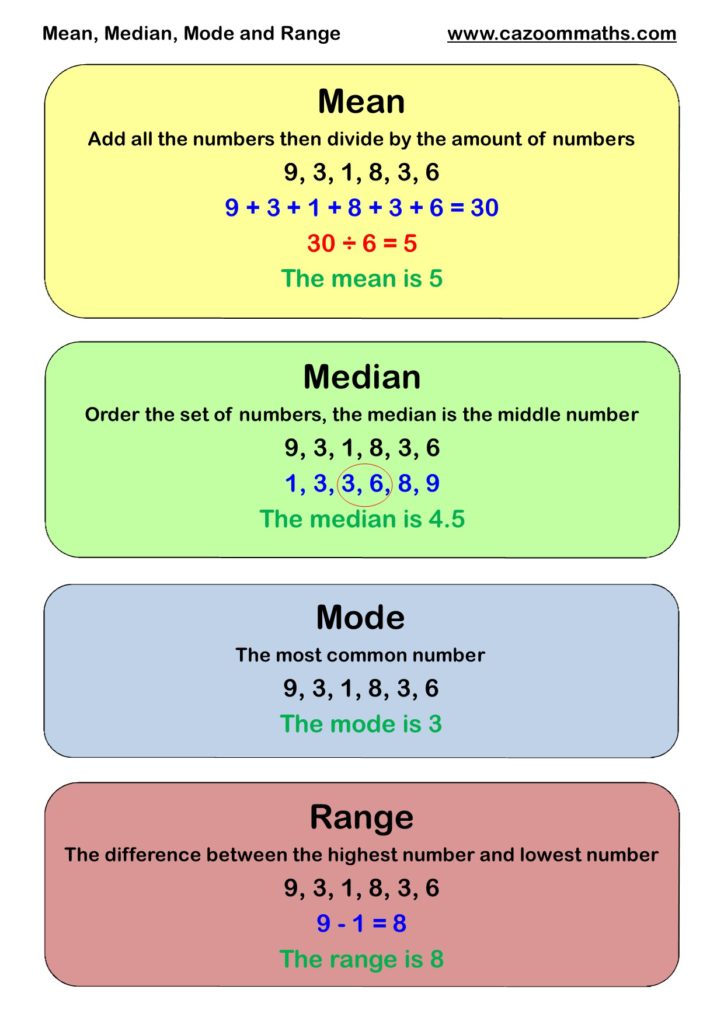
Mean, median, mode and range of data
Next week we will do a class survey and revise tally charts, bar graphs, pictographs and line graphs.
We will then learn how to represent data in line plots and stem-and-leaf plots.